EPA post for Bike to Work Day

This is crossposted to the EPA’s Greenversations blog, which is running series of posts by Federal employees about bike commuting for Bike to Work Week. Because I am, I do, and my awesome neighbor Jeff offered, I threw this together. Because I am a humongous sellout, I made no mention of that little unresolved AAA matter.

I have never considered myself very “green.” Sure, I ride a bicycle to work every day. In doing so, I avoid emitting well over a ton of CO2 into the atmosphere per year than I would if I drove to work instead, which is nice. But before I began riding regularly, any concern that I had for the environment was rather vague. I started riding primarily to avoid the nearly $10,000 a year needed to own and operate a car, and to keep myself healthy without having to carve out extra time from my day to exercise.

But as the miles on the bike piled up, I started becoming more aware of the natural environment around me. I noticed it in ways that one cannot from behind the wheel of a car, or from the seat of a bus, or speeding under the city on a subway. On any given day, I might see the deep-amber sunrise of a low-air-quality day, a milky-brown river from storm runoff, or the first cherry blossoms sprouting in springtime. Perhaps an offshore weather system shifted the breeze from its usual northwesterly direction, or the summer humidity sent steam rising off of asphalt.

In my days before the bike, I never would have noticed any of these things. My bike ride to and from work transformed ecology and the environment from an abstract concept into something that I saw, heard, and felt for 40 minutes, twice a day, for every day I went into the office. This remains one of the most surprising, and rewarding, aspects of bike commuting for me.

Whether this coming Bike to Work Day is your first time trying a bike commute, or just the latest of many, I would heartily encourage you to take a few moments on your ride to look around for the things that would otherwise fly by your window. I do on every ride, and it is often the highlight of my workday. Though, saving all that money and avoiding the gym is not bad, either.

Posted in Uncategorized | 1 Comment

AAA’s Minor-League Error, and Bike to Work Day

I don’t want to write this post. The upside is negligible and improbable. Since I work in the same sector as the subject, the downside is… let’s just not dwell on that. And this is going to veer away from the relatively irrelevant stuff I used to blog about. Sorry in advance.

Last week, a paid professional spokesman for AAA Mid-Atlantic gave what could be the , worst interview-while-sober ever, calling a critical local blog editor “developmentally retarded,” and comparing his colleagues and readers to the Ku Klux Klan. When this sort of thing spews forth from such thought leaders as Lindsay Lohan or Lady Gaga, it is rightfully condemned, sincere-sounding apologies are immediately issued, acts of contrition are performed, and ‘teachable moments’ are declared. While few walk away terribly satisfied with the whole transaction, we at least have a bit of hope that we have nudged the future decency needle just a bit higher.

Instead, AAA M-A issued a twitter-only apology that looked for all the world like a “non-apology apology.” The organization pinning blame solely on the man it pays to talk on their behalf, a cryptic spanner of doubt thrown in about “attribution,” and an assertion that “statements were presented out of context and mischaracterize the discussion.” Author Aaron Weiner pulled back the curtain on the context, and AAA M-A did not come out looking not worse.

I was among those who signed onto the byline of Greater Greater Washington’s response, and have waited for this past week for something to happen. A real apology, a firing, an act of contrition, maybe a donation to the R-word Campaign… Nothing. A few people cancelled their AAA memberships, folks checked into Better World Club, the Examiner ran a comparatively banal AAA M-A quote, AAA National warned us about the “breaking point” on gas prices, somebody started a parody twitter account, and AAA Safety reminded us that we can die on our bicycles. In other words, a return to normalcy.

I must admit that I have never liked AAA, either National or our regional chapter. Whether it is their local ‘war on cars‘ talk, their national lobbying against bicycles as transportation, or the many other instances where AAA at all levels has shown itself to be reliably opposed to the interests of sustainable transportation, I am irretrievably pessimistic that they will ever pass my own personal bike-ally litmus test [Would you answer ‘yes’ when asked, “If more people rode bicycles for transportation, more often, would that be a good thing?”].

I do not think they deserve a role in our big events, like DC’s Bike to Work Day, for those reasons alone. I have felt this way for a number of years. Many (many many) disagree with me, have told me so (sometimes angrily), passionately arguing that detente can be reached, that AAA is key to educating the driving public, and a ‘big-tent’ strategy is necessary for advancing bicycling. All fairly debatable points, and I only raise them so you may attack my motives, dear reader.

But last week, things hit a new level. And AAA M-A’s decency debt has accrued interest over this past week, at least with me. We are past the apology zone. Regardless of where you stand on the good-cop/bad-cop issues described above, I think many would agree that AAA M-A has burned its last bridge to our community. And their main arterial into our local community has always been their confounding sponsorship of DC’s Bike to Work Day.

It is time for that sponsorship to end. Establishing detente with unrepentant organizations who try to excuse their own hate speech is just not possible (at least I hope not). I challenge the organizers and co-sponsors of Bike to Work Day to:

  • Condemn AAA M-A’s recent conduct as incompatible with the ‘big tent’ of DC’s bicycling community. We gave AAA M-A ample opportunity to show themselves as allies. They have not only failed, but have since shown the darkest sides of themselves.
  • Ask that they refrain from taking part, either in-person or online, in any Bike to Work Day activities. It is too late to take their logos off the signs, but it is not to late for AAA M-A to exhibit a smidgen of shame.
  • Make clear that they will not be welcomed back as a Bike to Work Day co-sponsor without substantive organizational changes. DC’s bike community has sufficiently matured to the point that we do not need the endorsement of our foes for the sake of legitimacy.

I am not asking that people withhold registering or participating in Bike to Work Day. You should. Sign up now. Bike to Work Day is not only too important, but with Bike DC going back into hibernation, and the fact that we will not get an Open Streets event here until completion of the Global War on Terror, this is all we’ve got. You should enjoy it. Assuage any guilt by signing the R-word Pledge. Maybe Sharpie over the AAA logo on your t-shirt. Or just dismiss me as an oversensitive prat.

But barring some change, I will probably lay low on May 17th. The AAA’s R-word slur has put a stain on the day that AAA bikewashing will only make worse. I’ve participated in most (maybe all) Bike to Work Days since 2002, and I’ve got the garish neon rainbow of t-shirts to prove it. It is a testament to all involved that my staying away would cause an undetectable ripple among the sea of 14,000+ partying bicyclists, and I wish you all the best. But as it stands, it comes down to AAA Mid-Atlantic, or me.

Posted in Uncategorized | 7 Comments

Third option for a bike tax – do incredible stuff

Like eczema, kudzu, and Shia LaBoeuf, the odious notion of imposing a special tax on bicycling keeps popping back up, despite our best efforts to keep it down. The latest outbreak comes courtesy of the Pacific Northwest, where Washington State legislator Judy Clibborn [a Democrat] proposed a $25 fee on the sale of new bikes over $500 [though she seems to acknowledge the pointless symbolism of the whole exercise]. And in Oregon, legislator Tobias Read [also a Democrat, like the sponsors of Maryland’s helmet mandate bill. With friends like these…] has proposed to “impose” a “voluntary” bridge toll on bicyclists, in order to, “start a conversation.”

This conversation has not only been going on for years, it is rather one-sided, and definitely tiresome. Any sensible use tax policy seeks to discourage wasteful or damaging activities by charging more for them (like DC’s bag tax), and encourages activities that contribute to public goods by charging less for them, or even subsidizing them (“Cash for Clunkers”, sorta). Public goods provided by someone choosing to ride a bicycle in lieu of driving are reduced infrastructure costs, reduced personal costs of congestion, reduced public health costs (did you know that an estimated half of the annual $147 BILLION in direct health spending PER YEAR related to obesity is paid by the Gubmint?), reduced GHG emissions, and reduced costs of dependence on foreign oil (both direct costs and costs of security).

I would love to ask Representatives Clibborn and Read [and the Maryland legislature, and basically everyone in American government] the magic question: “If more people rode bicycles, would we all be better off?” A tip of the cap to Washington legislator Ed Orcutt (R) for his knee-slapping climatological rational for “no.

Seemingly, the sole purpose for a bike tax/fee is, in a best-case interpretation, to provide “an important starting point in an inevitable discussion about sharing road costs.” All those public goods should be sufficient to do so, but we are where we are, Americans. If this nonsense is “inevitable” (and I’m far from conceding that point), then how about we “start a conversation” about how this rot might actually work? Here we go, with something I uncleveringly refer to as the “Bike Fund”:

Do Incredible Stuff – If I am to pay more to transport myself in a way that provides all those benefits to everybody else, I will not pay to just keep slapping down a few sharrows and wave racks. I want extraordinary projects. I want stuff that will deliver the first-class, connected bicycle priority network I described a few months ago.

Guarantee the DOT Baseline Obligation – This bike tax nonsense has arisen out of the mistaken perception that our DOTs have been coddling us with massive expenditures for premium treatment. Before we begin paying more, we ought to require a firm commitment, through policies, staffing, and short- and long-term plans, that our transportation agencies will accept bicycling as a core part of their mission, and will fully obligate existing transportation formula funds for bicycling (like TAP and CMAQ) as a precondition of throwing more of our money into the till.

Independence and Merit – If bicyclists must pay, then bicyclists will pick. Whether voluntary or mandatory, whether toll or excise fee, revenue paid into the “Bike Fund” should be used on projects selected on technical merits, evaluated by a bicycle advisory council. Projects could be judged on factors like marginal ridership, equity, health impact, or air-quality impacts.

Leverage Other Funds – As noted above, a DOT commitment to fully obligate the “usual suspect” transportation funding sources in its plans would precede this “Bike Fund.” Revenue would be used to match transportation funding from other, traditionally road-centric funding sources, and “flexed” over for bicycles.

As noted by Rep. Clibborn, the revenue generated by a bike tax would be negligible anyway. So, let me propose that the “Bike Fund” leverage its revenue to seek complementary funding from three other sources: municipal exactions, public health funds, and project-specific ‘crowdfunding.’

  • Exactions from developers (such as money paid in-lieu of providing parking, or making improvements to a road adjacent to a property) are a lucrative source of funds for local governments. In areas such as parking and affordable housing, opportunities are sometimes given for developers to pay into a special-purpose fund to mitigate the issue, instead of having to exert the effort to directly provide mitigation measures itself. There are complications with this proposal, but there’s a lot of money there.
  • Public health stakeholders, such as government agencies, nonprofits, and healthcare providers, are recognizing the role of active transportation (such as bicycling), and are increasingly becoming involved in project funding. Bikesharing (in systems such as Boston’s Hubway and Minneapolis’ NiceRide) has attracted direct public health investment, perhaps due to its direct relationship with deploying projects that get people riding. The “Bike Fund” could become the counterpart for bicycle facilities, by providing a funding repository where public health money could go solely toward high-impact merit-based project delivery.
  • Crowdfunding of individual projects, as they move closer to delivery, would allow for voluntary community donations to speed projects along. How many other transportation modes can count on voluntary YIMBY donations for revenue, by the way?

So, to sum up… If we are to pay more, let’s demand more. A “Bike Fund” will help pay for premium facilities that complement the efforts of DOTs that do their duty. We’ll pick the projects, and we’ll seek out complementary sources of funding to multiply our influence. How does that sound? Let’s “converse,” legislators.

Posted in Uncategorized | 3 Comments

Bike sharing systems push to reach underrepresented groups

(crosspost to Greater Greater Washington)

Bike sharing has been a huge success in many cities and received many well-deserved plaudits, but some have criticized bike sharing for not necessarily serving all segments of the population. What are bike sharing systems doing to expand their reach?

Data on the demographics and socioeconomics of annual bike sharing users is only now emerging, and there are no comprehensive reviews of what bike sharing systems can do to ensure that they serve the entire community.

As a part of my graduate work at Virginia Tech’s Alexandria urban planning program, I asked managers of current and planned North American bike sharing systems what they have done to increase access to bike sharing for low-income communities, and minority groups disproportionately underrepresented in bicycling.

The size and scope of measures to promote bike sharing equity vary, but all types of bike sharing systems are working to lower access barriers.Whether a large established system with significant government investment like Capital Bikeshare, a new small nonprofit system searching for funding like Kansas City B-cycle, or a for-profit system like Decobike Miami Beach, operators are expending the effort to lower access barriers. Here some highlights of how they are doing it:

Station siting: Lowering access barriers starts with placing stations where they primarily serve low-income communities. For example, systems might consciously place stations adjacent to affordable housing, or prioritize expansion to minority neighborhoods disproportionately underrepresented in bicycling.

Many systems reported doing this, including NiceRide Minnesota, which placed 30 stations (or approximately 20% of their system) in areas identified by the community as necessary for equity.

Community-specific marketing and outreach: By reaching out specifically to low-income communities, or by targeting marketing and outreach to the concerns and communications channels of minority communities underrepresented in bicycling, bike sharing systems might be able to tap into latent demand in those communities.

In Arlington County, VA, the largest low-income group is Latinos with limited English proficiency. Arlington is planning a special Spanish-language outreach program for all of the county’s sustainable transportation programs, including Capital Bikeshare.

Financial assistance: Providing some variety of financial assistance was the most common way bike sharing systems promoted equity. Many lower-income people cannot afford the full cost of the annual membership at one time. To deal with that, several systems offer (or plan to offer) installment payment plans.

Bike sharing systems are also partnering with organizations to help qualified recipients obtain a bank account and debit/credit card. Capital Bikeshare introduced its partnership with Bank on DC over a year ago. This program combines a reduced membership fee with access to a credit card, and now has 90 participants.

Another measure that can relieve the financial barrier to bike sharing is not placing a temporary “hold” against a user’s credit or debit limit. Many systems put a hold on the full replacement fee for a bicycle, to guard against bikes not being returned. For people with little money in their checking account, this can make it impossible for them to buy necessities. Arlington is investigating ways to allow for cash payments, which would obviate the need for a debit/credit card entirely.

Boston’s Hubway provided over 550 annual memberships to qualified low-income recipients at a cost of $5 each, along with longer-than-normal free trip durations. Boston also investigated (but ultimately had to cancel) an idea dubbed “Prescribe a Bike,” where medical providers would refer at-risk patients to subsidized bikesharing memberships. The Boston programs are administered and funded by an obesity prevention public health program.

Economic contribution to communities: Bikesharing potentially provides intrinsic economic benefits to all communities by reducing the personal costs of travel for users, and increasing economic activity by generating more trips overall.

But beyond this, I asked systems about ways the bike sharing operations might be directly contributing to the economic well-being of low-income communities, such as actively recruiting employees from low-income communities, locating facilities (and their associated jobs) in places easily accessible to low-income neighborhoods, and partnering and subcontracting with community-oriented nonprofit agencies.

Denver B-cycle partnered with a local Goodwill Industries nonprofit agency to recruit employees from low-income communities. Motreal’s BIXI worked with a youth-service program to provide maintenance labor. Montgomery County, which is soon joining Capital Bikeshare, gave a preference for minority-owned small businesses in subcontracting procurement.

Safe places to ride: With the federal government investing fewer dollars for active transportation infrastructure in low-income neighborhoods, one possible barrier to using bike sharing could be the absence of safe places to ride a bicycle. I asked bike sharing systems to describe any efforts to encourage and promote installing new bicycle travel facilities near residents with lower incomes or disproportionately underrepresented in bicycling.

Kansas City B-cycle, a nonprofit bike sharing entity receiving less than half of its capital funding from government transportation funding (and among the smallest systems in the survey sample) is actively pursuing Safe Routes to School and other grants to directly institute bicycle travel facility improvements themselves.

Membership media: One way to make it easier to pay for bike sharing would be to integrate bikesharing payment media with other accounts that low-income people may already possess, including transit farecards and household utility billing accounts. A number of systems reported plans and efforts for farecard integration, but the hardware is not generally compatible, and there isn’t money available to retrofit the stations.

One system to watch is the planned San Francisco system, which requested in its RFP that bidders discuss whether their systems could be compatible with the regional transit Clipper Card.

Overcoming bicycling barriers: If people have little experience bicycling or don’t own helmets, it can create barriers to bicycling and bikesharing use. Several systems described programs to provide subsidized or free helmets and bicycle safety instruction workshops to communities they want to reach. They worked with bicycle shops, community colleges, and local bicycle advocacy organizations to deliver the helmets and provide the classes.

Boston’s Hubway offers reduced-cost helmets in retail locations in close proximity to stations, and gives free helmets to subsidized low-income members. It also offers instructional bicycling safety classes, though one Boston official characterized attendance at these classes as “low.”

For more details about the survey methodology, details on measures that each system is pursuing address access barriers, caveats, and some suggestions for further research, please take a look at the full paper (PDF). I hope that the report serves as a useful resource for existing and emerging bikesharing systems to broaden participation in this exciting new transportation mode.

Posted in Uncategorized | 2 Comments

Encouraging Equitable Access to Public Bikesharing Systems

Somewhere in the Blacksburg-to-Arlington I-81 logistics chain, a cardboard tube is being used by a warehouse worker to playfully thwack the noggins of co-workers. That cardboard tube might still contain my diploma. Or maybe a past-due notice on my library fines.

I’m getting this degree (hopefully) because I cranked out this paper, “Encouraging Equitable Access to Public Bikesharing Systems.” As I described in my last post, I fired off a survey to bikesharing operators, and received twenty responses describing the types and status of programs to lower access barriers in the following broad categories:

  • Station Siting
  • Financial Assistance
  • Safe Places to Ride
  • Membership Media
  • Community-Specific Marketing and Outreach
  • Overcoming Bicycling Barriers
  • Providing Economic Contribution to Communities

What you will find in the paper:

  • A snapshot of how many bikesharing systems have, are planning to, or have not deployed programs to address barriers to equity in each of those categories.
  • A few highlights of notable examples in each of the categories.
  • Some basic statistics and characteristics for each responding system
  • Some analyses of how those system characteristics influence their adoption of programs to lower access barriers.
  • Full responses from bikesharing system managers in the appendices.
  • Many many caveats.

What you will not find in the paper:

  • Any evaluation of the effectiveness of these programs.
  • Any judgment on folks doing “good” or “bad.”
  • Details and specifics on programs from all of the systems. Respondents were given free-form opportunities to describe their programs, and as expected, a variable level of detail was provided.
  • Any easy answers.

If there is any one conclusion to take from this report, it is that providing equitable access to bikesharing systems is hard, and no one claims that they have figured it out.  At best, this report will hopefully help systems and their stakeholders get some ideas of what is possible, and we can begin rolling toward highly inclusive bikesharing systems in a more structured way.

Posted in Uncategorized | 1 Comment

Bikeshare Equity Framework

[Are you there, Blog? It’s me, Darren. I know it’s been awhile, because of a 100-year storm of personal, professional, and scholarly timesuck. But I know you wouldn’t want to miss this post for anything!]

Increasing access to bikesharing for low-income communities, and groups disproportionally underrepresented in bicycling, is a bit of an obsession for me lately. And happily, others are interested too (unlike my previous side-project, a banjo-adaptation of “It’s the End of the World As We Know It (And I Feel Fine)”).

Some time ago, the Denver Post ran an article centered around the objection of Councilman Paul Lopez to the lack of stations accessible to his largely Latino constituency in SW Denver:

Lopez said the stations are needed in areas that are the least healthy in the city. His district has a high rate of obesity and diabetes, and he said residents should be given every type of encouragement to exercise.

“If it is truly about behavioral change, make it available where it is really needed or where it will have impact,” he said. “Is this truly, truly about the issues and behavioral change or is this just for looks?”

Soon after, the paper penned an editorial, that expressed the sad financial reality, that in the interest of remaining sustainable, Denver Bike Sharing had little choice but to site stations where they were projected to produce the most operating revenue, and that was regrettably not in Mr. Lopez’s district. I had the chance to speak with Parry Burnap, Denver Bike Sharing’s director, soon after, and we agreed that if there was a positive to be taken from the episode, it was that the need and desire for bikesharing expansion to neighborhoods where the total benefit would be highest had been publicly and evenhandedly highlighted.

Then, a few days ago, GridChicago had a great rundown of plans for the new Chicago bikesharing system to ensure that it is (gosh, I hate this headline though), “Bike share, not white share.” From the closing paragraph:

“My number-one priority is getting a membership that reflects the diversity of the city,” [CDOT deputy commissioner Scott] Kubly assures them. “Since we’re using public dollars, it’s important that the folks who are using the service reflect everybody in the community. It’s a challenge but we’re going to crack it.”

That’s where I hopefully can help out, with my forthcoming final grad school project on the topic. I blasted out a survey, asking both deployed and planned North American bikesharing entities to complete a short survey on how they are working to promote equitable access to their systems. I received responses from twenty systems (THANK YOU ALL OF YOU!!), and I’ll have the full report done in less than two weeks (hooray!). The responses validated what I will describe here – seven categories of stuff that bikesharing systems are doing, and can do, to promote equity. And yes, some are more important, or harder, or more expensive, than others.

Station Siting – This question asked bikesharing system managers if they were planning to ensure that some stations are located in areas primarily serving low-income communities. Examples might include conscious placement of stations adjacent to affordable housing, or prioritizing expansion to minority neighborhoods disproportionately underrepresented in bicycling.

Financial Assistance – This could be a partnership with a nonprofit agency providing bank accounts and debit/credit cards to low-income “unbanked” citizens, installment payment plans, subsidies for low/moderate income users, and relaxing security deposit requirements.

Safe Places to Ride – Bikesharing gets ridden more often near bike facilities, but socioeconomically-disadvantaged neighborhoods are significantly underfunded for these facilities. What is the bikesharing system doing to press the powers-that-be to bring bike facilities to those neighborhoods, to help ensure bikeshare gets ridden safely and more often?

Membership Media – Having a subsidized credit card to get a bikeshare membership is great. But most people already have a transit farecard. Perhaps a common payment card could not only lower a barrier, but could be one big step toward fuller integration of bikesharing with the public transportation system.

Community-Specific Marketing and Outreach – Or, efforts being made to introduce low-income and minority groups underrepresented in bicycling to bikesharing. By targeting marketing and outreach specifically to low-income communities, or by targeting marketing and outreach to the concerns and communications channels of minority communities underrepresented in bicycling, bikesharing systems might be able to activate latent demand for system use in these communities.

Overcoming Bicycling Barriers – The bikesharing system can make resources available that could help lower psychic barriers to bicycling and bikesharing use among low-income and minority groups underrepresented in bicycling. Examples include making helmets and basic bicycle instruction easily available.

Providing Economic Contribution to Communities – Bikesharing can provide some intrinsic economic benefits to all communities, such as reducing the personal costs of travel for users, and generating more trips overall that result in additional economic activity. However, this question asked bikesharing systems about ways in which the operations are directly contributing to the economic well-being of low-income communities. Examples might include recruiting employees from low-income communities, locating operations in places easily accessible to low-income neighborhoods, and partnering and subcontracting with community-oriented nonprofit agencies.

In a couple of weeks, I’ll have the full report, with details on what different systems are doing, discuss patterns of who’s doing what, etc etc. But in the meantime, what did I miss?

Posted in Uncategorized | 10 Comments

Bikeshare Bike to Dock Ratios

In case you couldn’t deduce from the title of this post, my previously-mentioned blogging humdrumspringa continues. Not that I was crashing servers to begin with, but I’m still holding back on posting anything remotely interesting for the time being. In that vein, some poor soul googled “bikeshare bike to dock ratio,” and ended up on my post regarding measuring bikeshare system performance using rides-per-dock.  Please, sir/madam, step into my cubicle….

Short answer: Go to page 56 this great bikeshare report (big pdf) from the Mineta Transportation Institute. Lead authored by Dr. Susan Shaheen at UC Berkeley (who was on a panel with me at Rail~Volution), this report is a comprehensive state-of-the-practice of bikesharing in North America. Most systems aim for a 2-to-1 dock-to-bike deployment ratio, including DC’s Capital Bikeshare. In fact, it is not uncommon to look at DC’s live system status and see a ratio around 2.2-to-1. Hope that helps, anonymous browser.

Longer unsolicited opinion: As argued in my prior post, taking bikes out of the active fleet to prevent “service failure” is a valid strategy, but it trades off labor savings (for redistribution) and/or ridership gains (from having more bikes active) for the additional capital cost to deploy more empty docks. A European report on bikeshare operations (another big pdf) notes that large European stations go as low as a 1.5-to-1 (in the case of Velib in Paris, for one). A higher dock-to-bike ratio is a capital-intensive way to provide system balance, and ridership metrics should account for this inefficiency. Hence, rides-per-dock.

However, I am not necessarily advocating that systems uproot stations in search of sites where bikes turn over throughout the day (think Dupont Circle, CaBirazzi), thus accommodating more bikes filling docks. Bikeshare systems need to manage themselves on a variety of sometimes antagonistic measures – revenue, ridership, equity, health/air quality impacts, and operating expenses are among the many necessary measures of success. But making more efficient use of capital assets to generate rides, and benchmarking against others in this way, can point to a need for improvements in marketing, operations, siting, or other factors that impact ridership. More aggressive goal-setting in filling docks with more bikes should accompany pursuit of these improvements.

Posted in Uncategorized | 2 Comments

Rail~Volution Trip Wrap

A fun, if all-too-brief, trip out to Hollywood (that screwy ballyhooey Hollywood) to panel-chat about linking bikesharing and transit. Slides posted here – if you’ve been at another shindig where I’ve chatted on the same subject, you won’t find much new, except for one slide with some summary info on the demographics of Capital Bikeshare users and DC/Arlington bicyclists. That data is pinched from a paper still in draft that will be finalized in the next few weeks for another conference. Interesting stuff, says the guy posting powerpoint slides on a Friday night.

This trip was my first trip with my Brompton, carried in a soft-sided ‘B-Bag’ purchased from my chums at BicycleSPACE. It worked out extremely well for me. Kate Ryan has a rather thorough guide to thinking through your Brompton travel options, to which my only addition would be that for short trips, packing your clothes and shoes into the B-Bag not only saves you having to pack a separate bag, but gives good padding for the bike, and remains well under the 50lb limbo pole. Also, the shoulder strap on the B-Bag lets you bike to/from the airport, if so inclined.

I was traveling on a rather severe budget, so I stayed at a rather cheap motel, located a half-mile or so from the Rail~Volution venue. A happy surprise was finding my lodgings at one end of a bike boulevard, and the venue at the opposite end. Hooray for intersection traffic diverters!

Anyway, go to Rail~Volution if you ever have the chance. And definitely present if given the opportunity – I have presented 3 or 4 times on bikesharing, and the audience discussion was the most sophisticated and engaging that I have experienced to date.

Posted in Uncategorized | 1 Comment

Changes in Natitude, Changes in Rackitude

As a follow-up to yesterday’s bike counting expedition to Nats Park, I decided to do it again. No, I do not have much of a social life.

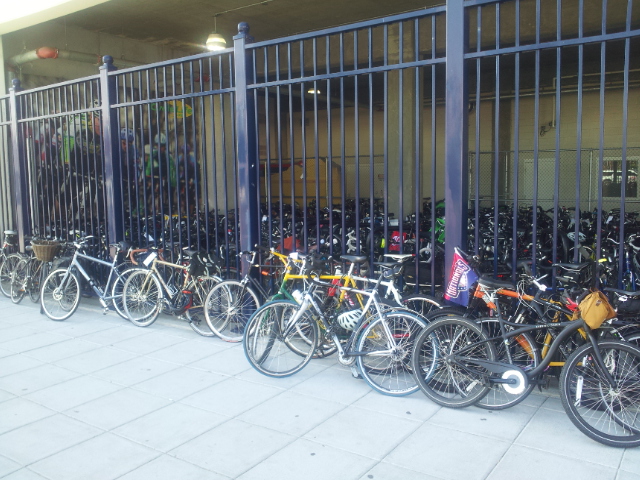
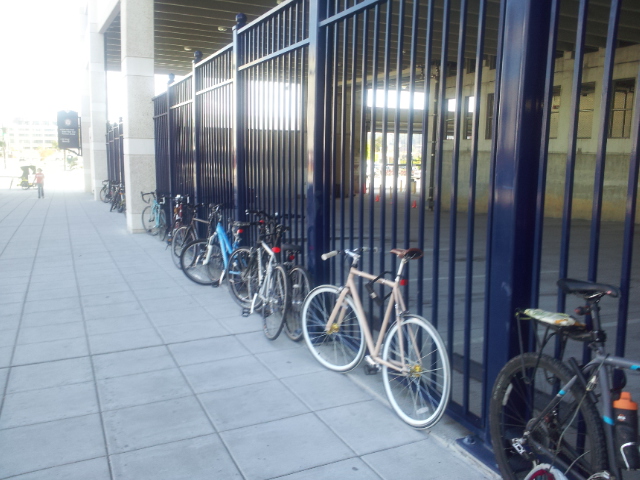
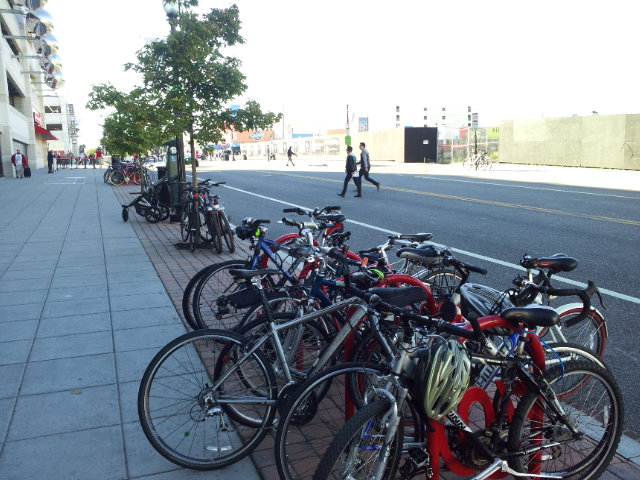
So, on the highly trafficked north/northeast side of the stadium, racks remained packed:

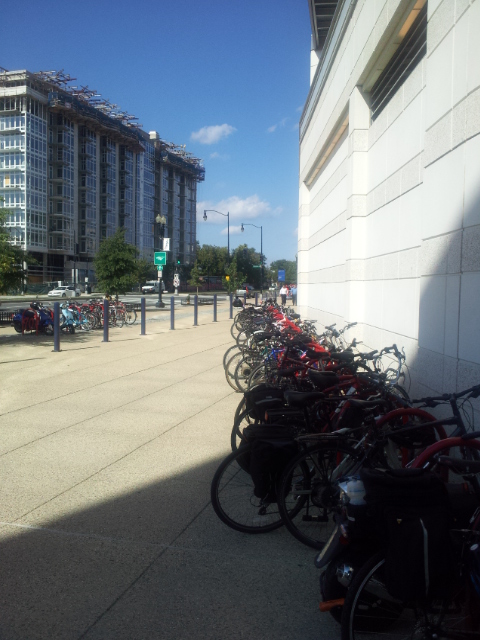
However, other racks around the stadium were quite a bit roomier than yesterday, like this one on 1st St:

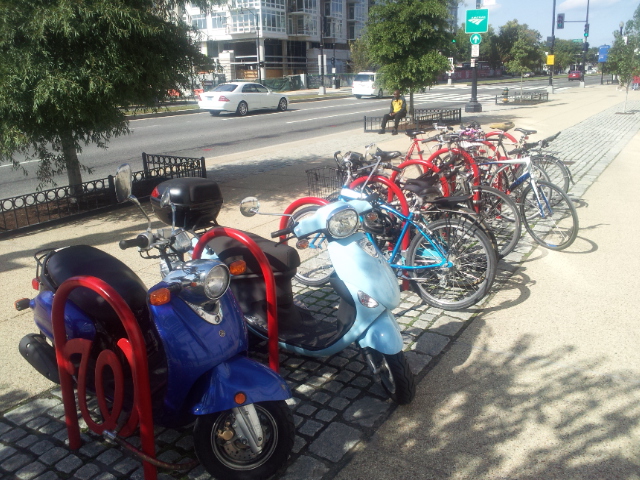
Or these along South Capitol St, that were teeming full on Wednesday:

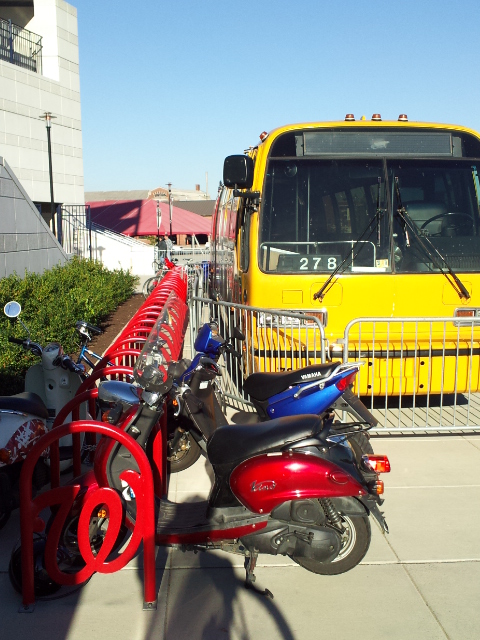
I don’t recall this unoccupied and fenced-off Fairfax-Connector-colorway bus yesterday, hording about 30 or so parking slots [I also don’t see a lock on it, so keep your eyes peeled for it on Craigslist]:

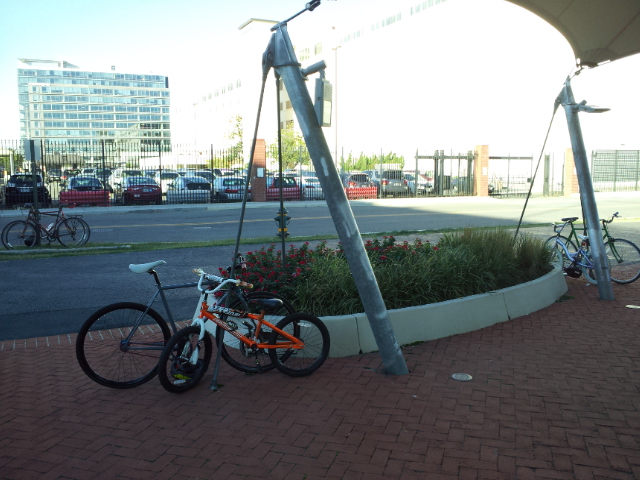
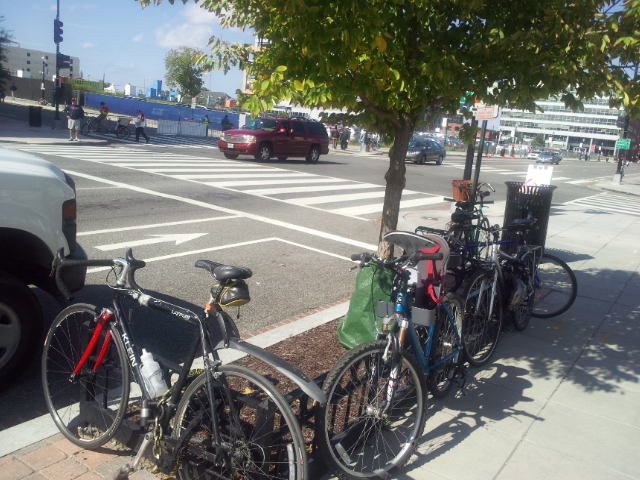
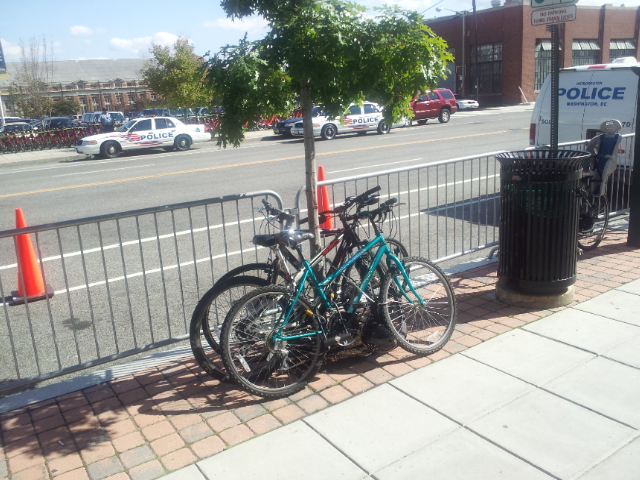
Many still took advantage of opportunities to lock to whatever they could find in the vicinity of the N St side.

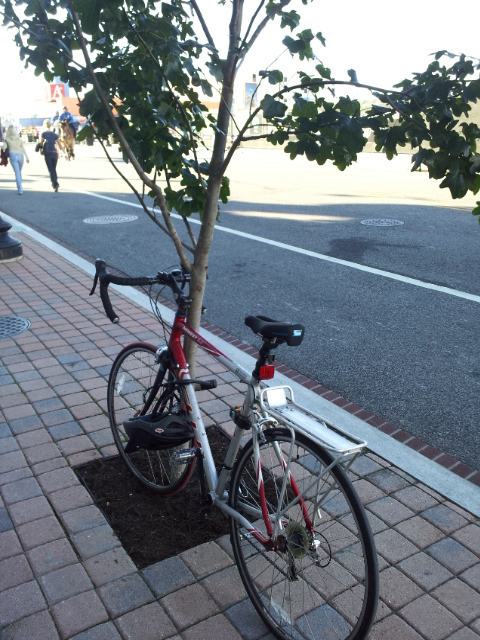
Like trees. Sigh.

Results!(?)

  Oct  10th Oct 11th Change
Bikeshare 160 170 6.3%
Bike Valet 120* 100* (16.7%)
Bike Racks 250** 150 (40.0%)
Signposts 50 40 (20.0%)
Treeboxes 15 10 (33.3%)
N St Fence 25 8 (68.0%)
Trees 8 5 (37.5%)
Total Counts 628 483 (23.1%)

*Bike Valet “counts” were obtained by me cruising by the lockup, observing that the cage was full on both nights, and on Wednesday, counting the number of bikes visibly propped around the cage, and adding that to the reported capacity of the valet (100). Commenter Corey questions that 100 bike capacity, and Commenter Andrew reports a firsthand number reported Wednesday by one of the staff that is FAR higher (420!). Would love some official confirmation from the Nationals…

**Was that Fairfax-Connecterish bus there on Wednesday? I don’t recall seeing it, but if so, subtract 30 riders from Wednesday’s tally, bringing the decline to 19.2%.

Overall attendance was 1.4% lower, at 44,392, which puts our estimated bike modeshare at around 1.1%. Both assume my much lower estimate for the bike valet, and assume that the bus was not in fact there on Wednesday.

Caveats:

  • I did both counts around 40-45 minutes after first-pitch. While anecdotal reports indicated that on Wednesday, folks defied the DC stereotype of fans being fashionably late to sporting events, I do not know if that held for Game 4.
  • Wednesday’s game started just after 1PM, while yesterday’s began well after 4PM. Tonight’s game (at which I will not be loitering around taking pictures of bicycles and receiving the collective stinkeye of the police) begins after 8:30PM.

Theories for decline in bike modeshare:

  1. Biking While Intoxicated (BWI) – (Yes, it is a crime). Commenter Lauren theorized that fans overall decided not to bike because they wanted to imbibe at the park. I extended that theory to suggest that it could help explain the disproportional CaBi ridership, since bikeshare allows for the possibility of a one-way trip, while a secured bicycle has to either be taken home or left overnight.
  2. The High Cost of Crap Parking – Commenter Jim Moore infers, and Commenter Chris anecdotally attests, that a lack of sufficient quantity and quality of bike parking influences mode choice. Given my own experience elsewhere, I can certainly sign onto that theory, and some season-long data and a travel survey of Nats fans could help shed a whole lot more light on the issue.
  3. What Gets Counted Gets Mounted – A city agency, the Washington Post, and fans of the system itself are excitedly and understandably cheerleading the growing use of CaBi for events. Riding a personally-owned bike (or “unrestricted bikehording system membership,” if you like) gets memorialized for double-digit readership by this guy. Chipping in on something so loudly lauded as successful makes it “Werth” it (apologies). Ask Portlandites about their bike barometer, for instance.
  4. The twilight darkens, the Metro calls – People are less apt to ride a bicycle in the dark. That might help explain the falloff from Wednesday to Thursday. I will not be observing tonight, but the CaBi Corral Count for tonight’s game might provide a useful proxy measure.
  5. DC bicyclists, in the aggregate, are loathsome frontrunners – Considering Wednesday’s shellacking, entirely possible.

Conclusions:

Very few. There’s a big spatial mismatch between bike parking capacity (distributed relatively evenly around the perimeter of the stadium), and demand (N St). Even where capacity is sufficient to give everyone a rack space, the spatial mismatch meant that 13% of riders were locking to something that was not a bike rack (down from 16%). Conversely, CaBi riders are provided certain parking at the high-demand zone of the stadium, and perhaps due in part to some of the theories floated above, CaBi’s share of all bike rides rose from 26% to 35.2%, both far above CaBi’s overall estimated 11% share of all bike rides in DC/Arlington.

Posted in Uncategorized | 3 Comments

Biking Natitude

[Note: This is the first of two posts on bike modeshare to Nationals Park during the NLDS. A second round of counting, collected on 10/11/12, is summarized and discussed here]

In a futile bid to feel the buzz of playoff excitement occuring two short blocks from my office (well, besides feeling the buzz of that pregame jet flyover rattle my building), I broke away from my cubicle just before 2PM, pulled a CaBi bike, and did a rough count of about how many folks rode a bicycle to Nats Park today.

Bikeshare — We know that just over 100 folks made use of the Capital Bikeshare corral at the stadium around first pitch time. When I biked by, not much was going on, so we’ll assume that was about it. I checked the O’Brien map in the leadup to the game, and it looked like all three nearby bikeshare stations filled with game patrons, so that’s another 55 or so riders. In all, that’s about 160 bikeshare whips, or about 9-10% of the deployed fleet.

Nats Park Bike Valet— I wish I could find a citation, but I am quite sure the Nats Park bike valet holds 100 bikes. As seen below, they were not only filled, but had 20 bikes propped along the walls.

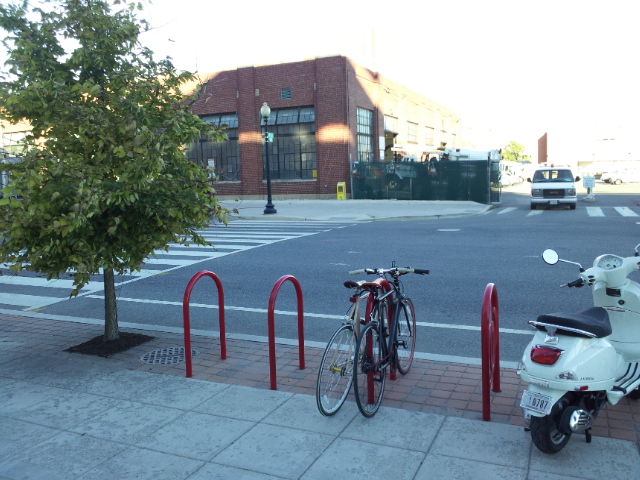
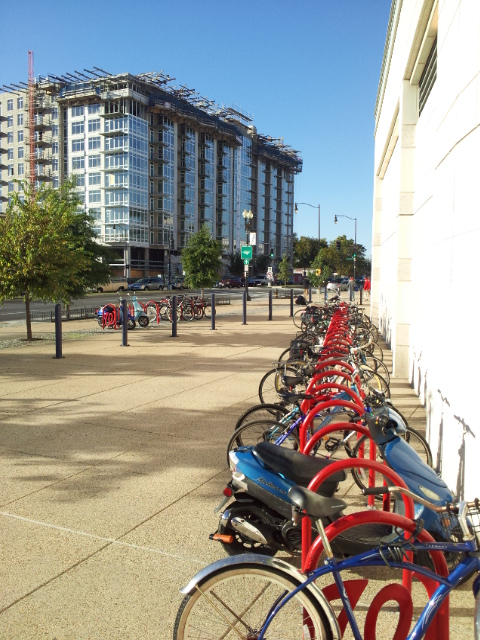
Nats Park Racks – DCist says that there are over 250 rack spaces. Most were filled:

…Though scooters gobbled up a few extra slots…

…And that one lonely predictably sparse rack at the corner of South Capitol and Potomac Ave SE.

So, let’s call the whole thing a wash and say 250 bikes in racks, OK?

The People’s DOT Racks — There was a bunch of unofficial parking.  I counted 25 or so locked to the N St fence…

…Another 15 or so lashed to treeboxes…

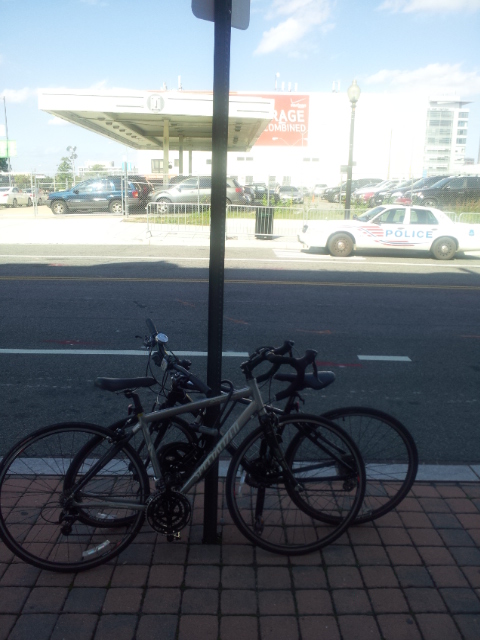
…And at least 50 lashed to signposts…

…and 8 sadly locked to trees.

Total — By my count, that’s a total of 628 bikes. Only 530 (or 84%) were accomodated by official parking/storage, including the 26% of all riders who used Capital Bikeshare (above my estimate of CaBi comprising 11% of all ridership in DC/Arlington, it should be noted). Rides/riders I did not or could not account for:

  • Pedicab riders – there were a ton of pedicabs around, and I have no idea how many folks they carried.
  • Plural Bikes – there were a few bikeseats on bikes, I think I spotted a tandem and a cargo bike, and I have no idea how many of those passenger seats were occupied.
  • Off-site parkers – a few riders may have parked in adjacent garages at their offices, or maybe parked a few blocks away for easy escape, I only rode the perimeter of the stadium, and the route to/from New Jersey Ave.

In all, those missing rides are likely negligable, but it makes sense to note them.

Bottom-Line It For Me – With a stadium capacity of around 41,000 45,017, that’s about 1.5% 1.4% of people biking to the game. Following an odd DC trend, this is far lower than our commute-to-work share of 3.3%, and right on par with Washington DC’s estimated bike modeshare for all trips of 1.5%.  Given the unfathomably awesome weather, the fact that transit is beginning the rush-hour meltdown everyone knew was coming even as I type this, and the fact that Nats Park lies right in the heart of Livable Walkable Ward 6, I would have expected more (acknowledging that looking solely at the one transportation mode I obsess about is a distortion). What’s missing?

More than usual appeared to take Capital Bikeshare, and perhaps the promise of a guaranteed “dock” influenced that choice. Some additional bike parking, even as a temporary measure, would at the very least save folks from the slightly shameful act of having to lock up to a tree or fence. Some sheltered bike facilities anywhere in the SE/SW quadrants would boost ridership for everyone. And on and on.

Posted in Uncategorized | 12 Comments